Ooi Solutions · Case file

Dot2Dot Malaysia

A logistics and packaging company whose website couldn't generate a single qualified lead. We spent 12 months rebuilding its digital presence - and measured all of it.

dot2dot.com.my  ·  Mar 2024 - Mar 2025  ·  18 interventions

+124%Organic traffic
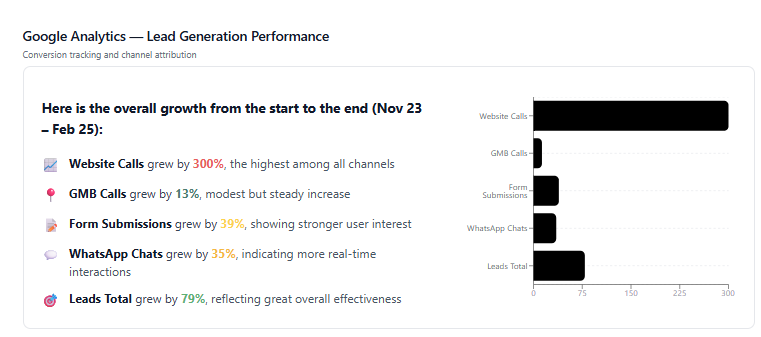
+89%Total leads
3.2MSearch impressions
+67%Form submissions

Source: Dot2Dot growth & performance report - GA4, Google Search Console and lead tracking, Mar 2024 → Mar 2025.

Admission notes

A logistics company invisible to the people searching for it

Dot2Dot provides logistics, packaging and printing services across Malaysia. Their website was technically present but functionally absent - slow, unstructured and unable to convert the B2B buyers landing on it.

The situation

  • Established logistics and packaging company serving businesses across Malaysia
  • Multiple service lines - packaging, printing, warehousing, distribution
  • B2B buyers searching for specific logistics solutions locally
  • Website existed but generated almost zero inbound enquiries

What stood in the way

  • Pages averaging 14+ seconds to load on mobile - unusable for on-the-go procurement teams
  • Service pages built as single text blocks with no structure or calls to action
  • No SEO foundation - missing titles, meta descriptions, schema and internal linking
  • Images unoptimised, no lazy loading, no responsive sizing
  • Contact forms buried at the bottom of long pages with no prominent CTA

Scope

18 interventions, four workstreams

Documented in full in the Dot2Dot growth & performance report.

Web Development

  • Full responsive redesign of all service pages
  • Mobile-first layout overhaul
  • Contact form redesign with above-the-fold placement
  • Clear service-specific landing pages
  • Integration with CRM for lead capture

Technical SEO

  • Weekly Screaming Frog & SEMrush audits
  • Title tag and meta description optimisation across 120+ pages
  • Schema markup - LocalBusiness, Service, BreadcrumbList
  • Canonical tag and redirect chain cleanup
  • XML sitemap rebuild and Search Console resubmission

Performance Optimisation

  • Image compression and WebP conversion
  • Lazy loading for below-the-fold assets
  • Critical CSS inlining
  • Render-blocking script deferral
  • CDN configuration and cache headers

Content Strategy

  • Service-specific landing pages with structured copy
  • Industry vertical pages for target sectors
  • FAQ sections targeting long-tail queries
  • Case studies showcasing existing client work
  • Regular blog content on logistics and packaging trends

Before & after · performance

What changed, metric by metric

These are the live Dot2Dot performance measurements as they were, and as we rebuilt them. Screenshots come straight from the client performance report.

01

PageSpeed Insights

A site that took over 14 seconds to show its first meaningful content - now under one.
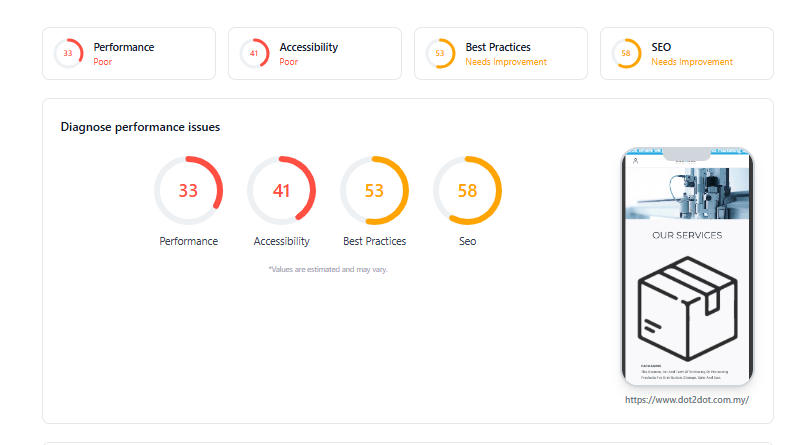
Before
  • Performance score deep in the red zone
  • LCP exceeding 14 seconds on mobile
  • Render-blocking resources delaying first paint
  • No image optimisation - oversized PNGs served at full resolution
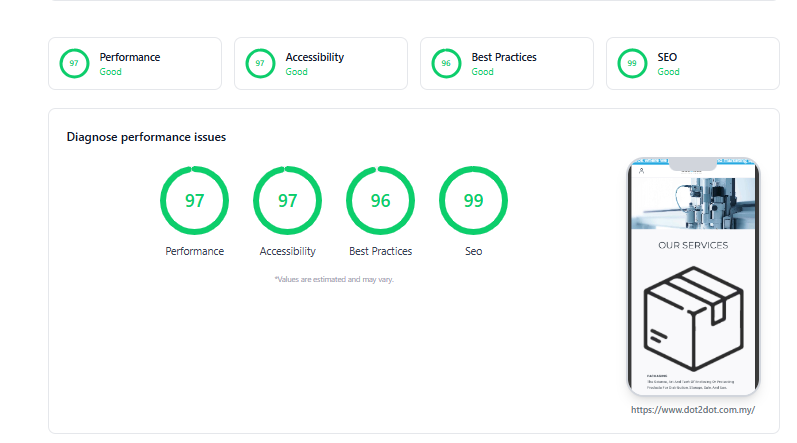
After
  • Performance score in the green zone
  • LCP dropped to under one second
  • Critical CSS inlined, scripts deferred
  • Images converted to WebP and correctly sized per viewport
Screenshots: Dot2Dot growth & performance report.

Core Web Vitals

The vitals, before and now

Google's threshold for a good LCP is 2.5 seconds. The Dot2Dot services page was nearly six times over it.

Baseline
14.6sLCP
5.2sFCP
7.8sSpeed Index

Where those 14.6 seconds went

TTFB8%1,170ms
Load delay48%7,008ms
Load time38%5,548ms
Render delay6%874ms

Source: Core Web Vitals baseline report for dot2dot.com.my.

Today · assessment passed
0.9sLCP
120msINP
0.05CLS

Other notable metrics

First Contentful PaintGood0.6s
Time to First ByteGood0.2s

Source: PageSpeed Insights, 15 Jul 2026 - real-user field data.

Read this carefully

The 14.6s baseline is a Lighthouse lab test of the services page. The 0.9s is field data for the homepage. Different page, different measurement - a like-for-like re-run of /services would close the loop.

Still on the list

Lab performance sits at 68: render-blocking requests (~310ms), 194KiB unused JavaScript, 12KiB unused CSS and 5 long main-thread tasks all remain open.

The unglamorous part

The problems that don't fit in a pitch deck

Most of this engagement was infrastructure nobody sees. It's also the reason the rest worked.

Oversized unoptimised images

Product and service images were uploaded at full resolution - multi-megabyte PNGs served with no compression, no lazy loading and no responsive sizing.

No technical SEO foundation

Pages had duplicate titles, missing meta descriptions, no schema markup and broken canonical tags across the entire site.

Render-blocking JavaScript

Third-party scripts loaded synchronously in the head, blocking rendering for over five seconds on mobile connections.

Zero lead capture strategy

Contact forms were buried at the bottom of long pages with no above-the-fold CTA, no phone number visibility and no chat widget.

No content hierarchy

Service pages were single walls of text with no headings, no internal links and no structured content for search engines to parse.

Hosting infrastructure

Server response times were inconsistent - TTFB fluctuated between 1.2s and 4s depending on server load, requiring CDN and caching configuration.

Results

What 12 months delivered

Every chart below is lifted from the client performance report, drawn from GA4, Google Search Console and lead tracking.

Google Analytics overview

Mar 2024 → Mar 2025

Google Analytics dashboard showing growth in users, sessions and engagement over 12 months

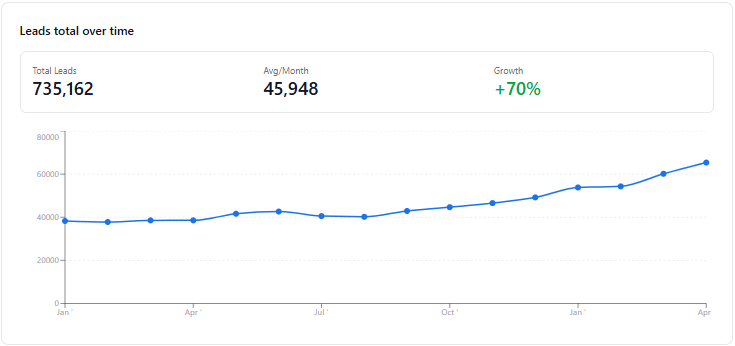
Total leads over time

Monthly, Mar 2024 → Mar 2025

Line chart of Dot2Dot total leads per month, rising steadily over 12 months

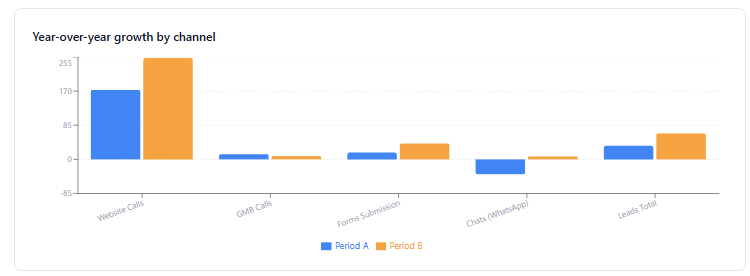
Year-over-year growth by channel

Mar-Jun 2024 vs Mar-Jun 2025

Year-over-year growth by channel for Dot2Dot, organic search up significantly

Evidence

The traffic engine behind the leads

Search visibility and audience growth, straight from the consoles.

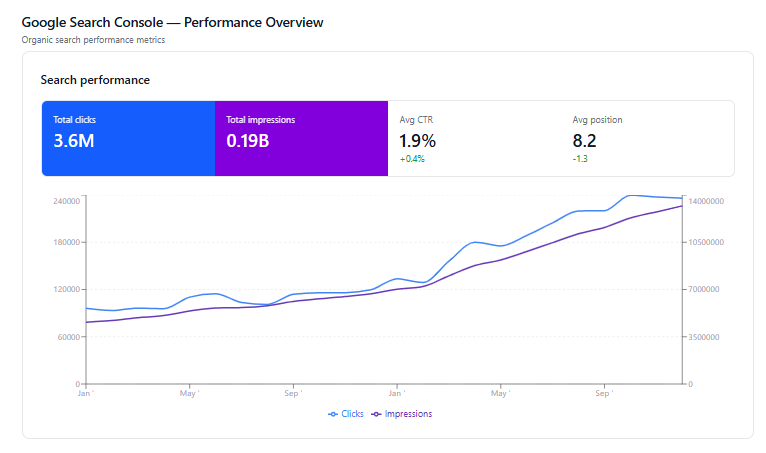
Google Search Console - clicks & impressions

3.2M impressions · 87K clicks · 2.7% average CTR · average position 14

Google Search Console chart showing impressions and clicks trending upward for dot2dot.com.my

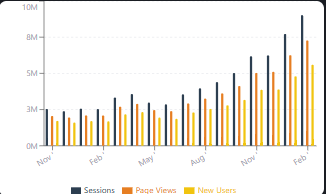
Sessions, page views & new users

Google Analytics · monthly

Bar chart of sessions, page views and new users rising together each month for Dot2Dot

Retention

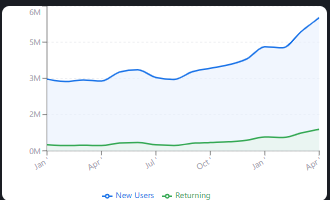
New users vs returning visitors

Retention overview showing new and returning users for Dot2Dot

Ooi Solutions

We do this for logistics at scale.

12 months, 18 interventions, +124% organic traffic - and every number on this page can be checked in GA4, Search Console or PageSpeed Insights. That's the point.

ooisolutions.in  ·  hello@ooisolutions.in