Ooi Solutions · Case file

Medicover Hospitals

A multi-city hospital group whose website couldn’t show its scale. We spent 16 months fixing that - and measured all of it.

medicoverhospitals.in  ·  Nov 2023 - Feb 2025  ·  23 interventions

+79%Total leads
+300%Website calls
59.7MSearch clicks
+39%Form submissions

Source: Medicover growth & performance report - GA4, Google Search Console and lead tracking, Nov 2023 → Feb 2025.

Admission notes

A hospital group with scale - and a site that couldn’t show it

Medicover runs hospitals across Telangana, Andhra Pradesh, Maharashtra and Karnataka. Every location and specialty is its own search opportunity. Almost none of them were being captured.

The situation

  • Multi-city hospital network across four states
  • Hundreds of doctors, dozens of specialties, many locations
  • High-intent patients searching locally - for a doctor, a treatment, a hospital nearby
  • Every location and specialty a separate search opportunity, largely uncaptured

What stood in the way

  • Key landing pages built as long text walls - little hierarchy, weak calls-to-action
  • Repeated server outages disrupting crawling and indexing
  • Google-translated URLs creating canonical and indexing conflicts
  • Pages missing from the server entirely
  • Toxic and spam backlinks dragging on authority

Scope

23 interventions, four workstreams

Documented in full in the Medicover growth & performance report.

Technical SEO

  • Weekly Screaming Frog & SEMrush audits
  • Search Console issue triage
  • Programmatic schema - breadcrumbs, FAQ, physician, aggregate rating
  • Page-speed work on LCP, CLS & INP
  • Toxic and spam backlink removal

Content at scale

  • Programmatic SEO pages
  • Web Stories
  • Health calculators
  • Quarterly optimisation of low-performing content
  • Article & blog rebuild

UI/UX rebuild

  • Doctors, hospitals & specialties revamped
  • Second Opinion page
  • International Patients page
  • Header & footer
  • Three targeted CTAs

Local & off-page

  • GMB revamp for every hospital and doctor
  • Near-me keyword optimisation
  • Profile verification
  • Competitor gap analysis
  • Guest blogging to pass link equity

Before & after · the pages

What changed, page by page

These are the live Medicover pages as they were, and as we rebuilt them. Screenshots come straight from the client performance report.

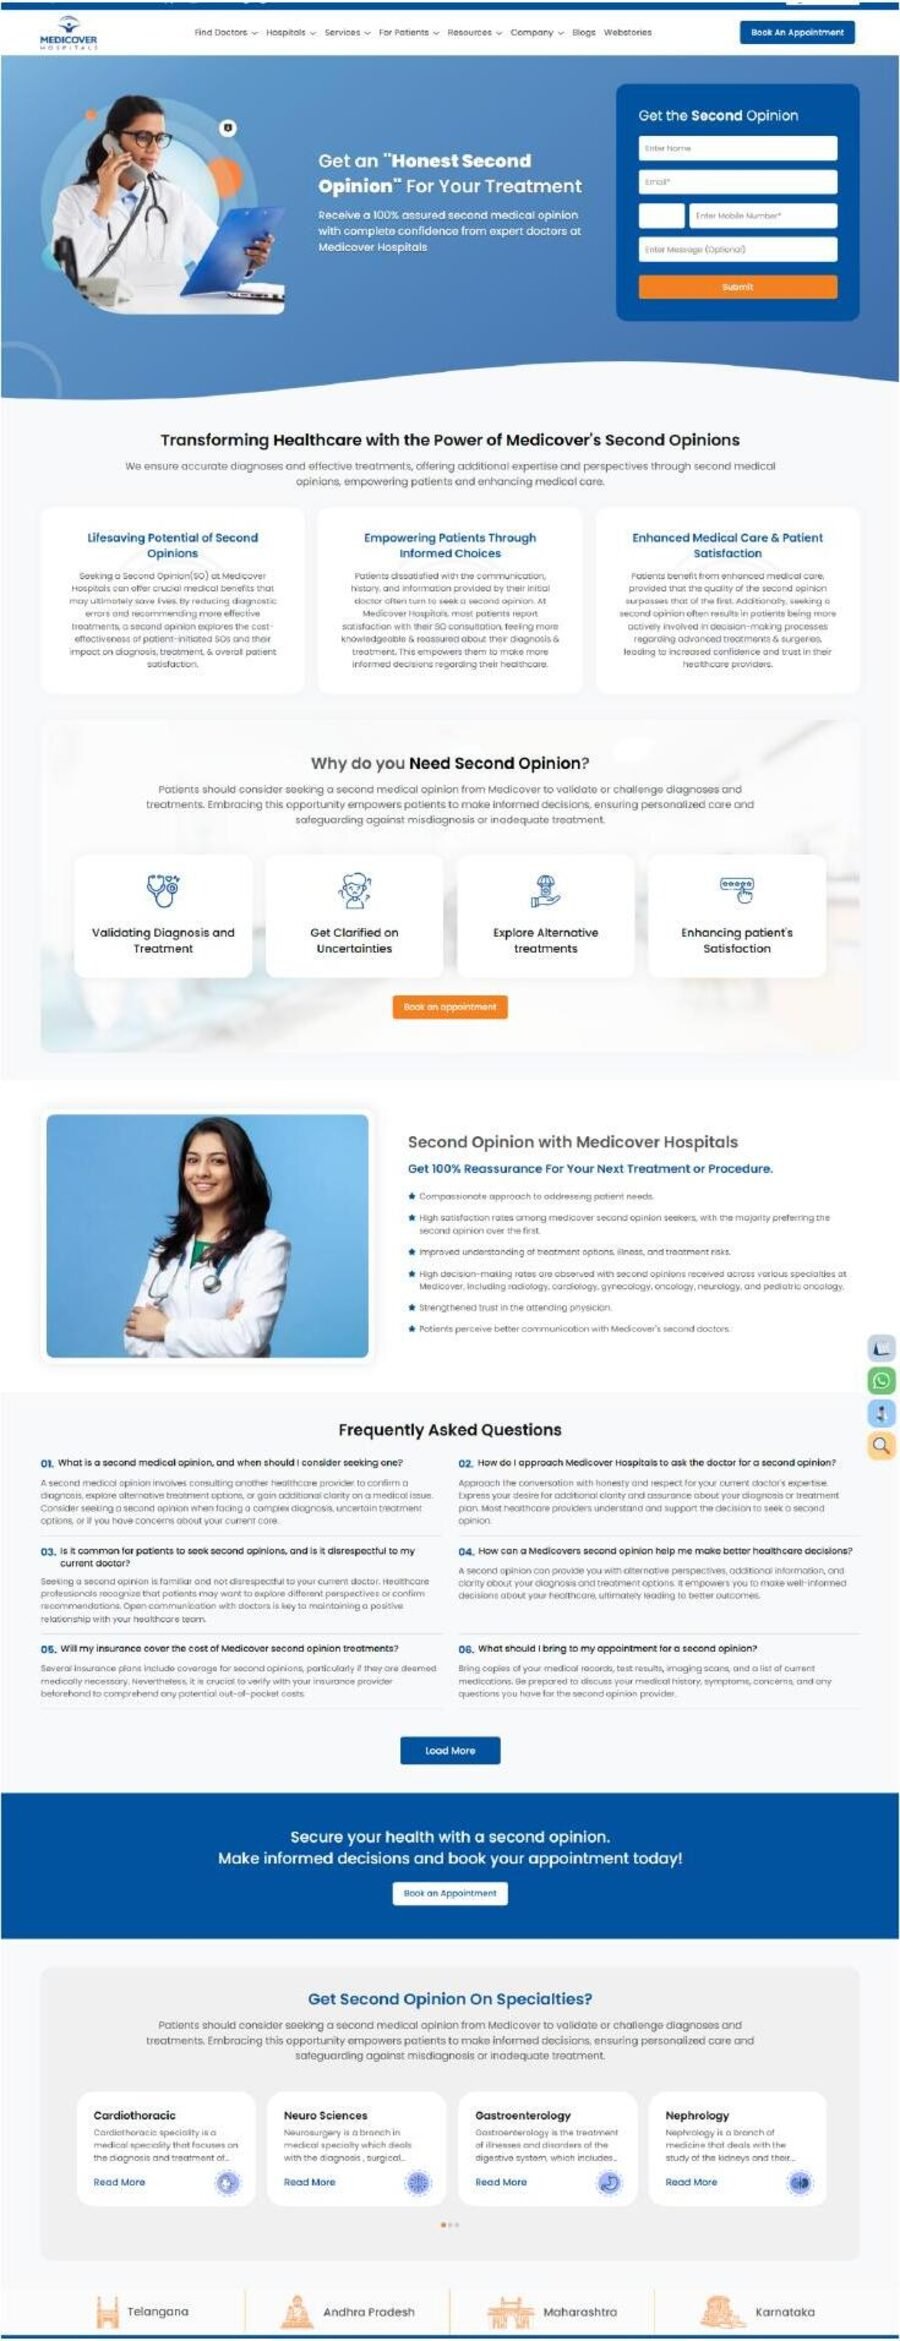
01

Second Opinion

A high-intent service with no page built to convert it.
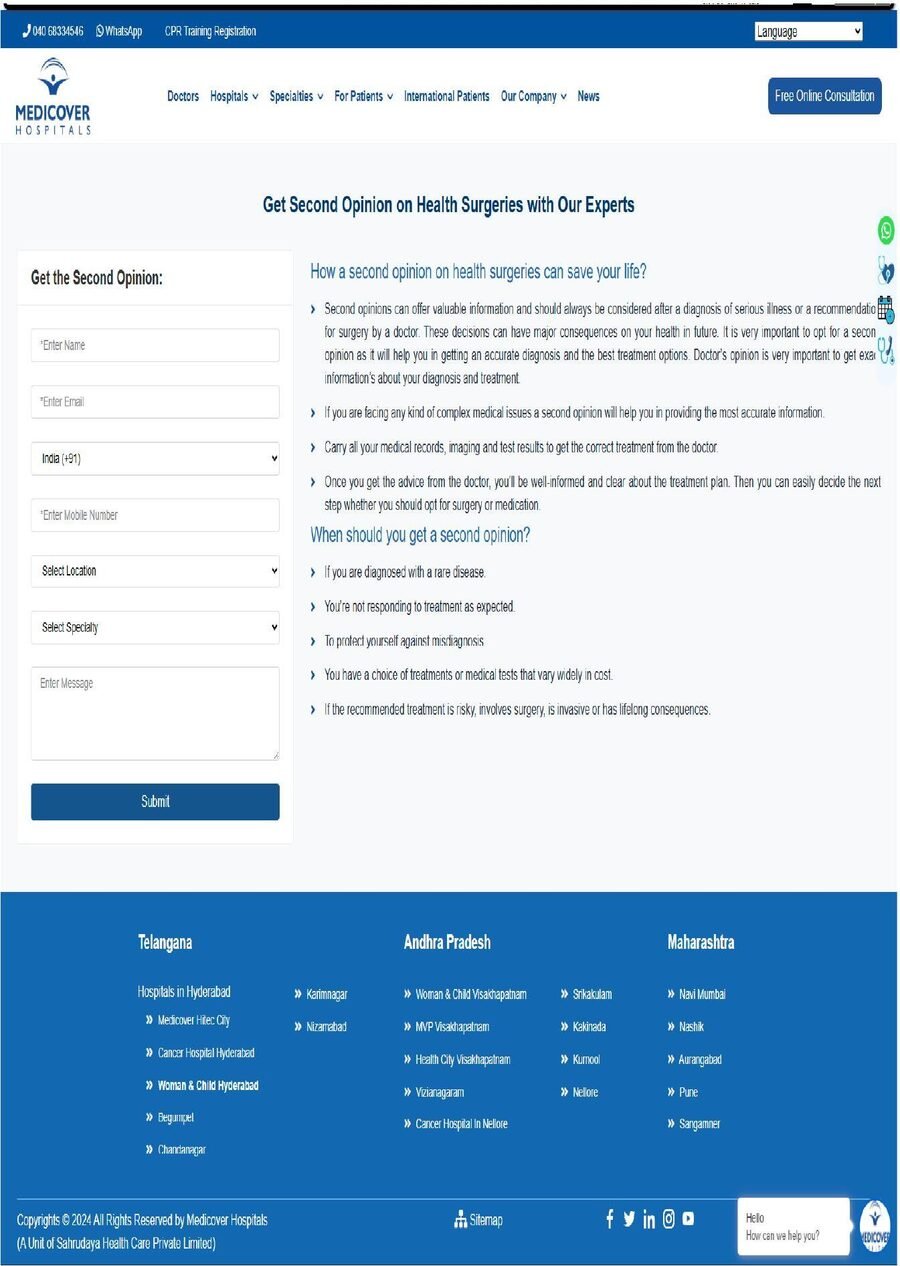
Before
  • Bare form beside a wall of unstructured text
  • No visual hierarchy or trust signals
  • Single entry point, easily missed
  • Nothing to guide a hesitant patient
After
  • Hero with the form placed front and centre
  • Benefit and reassurance cards
  • “Why do you need a second opinion?” explainer
  • Specialty routing plus FAQs and repeated CTAs
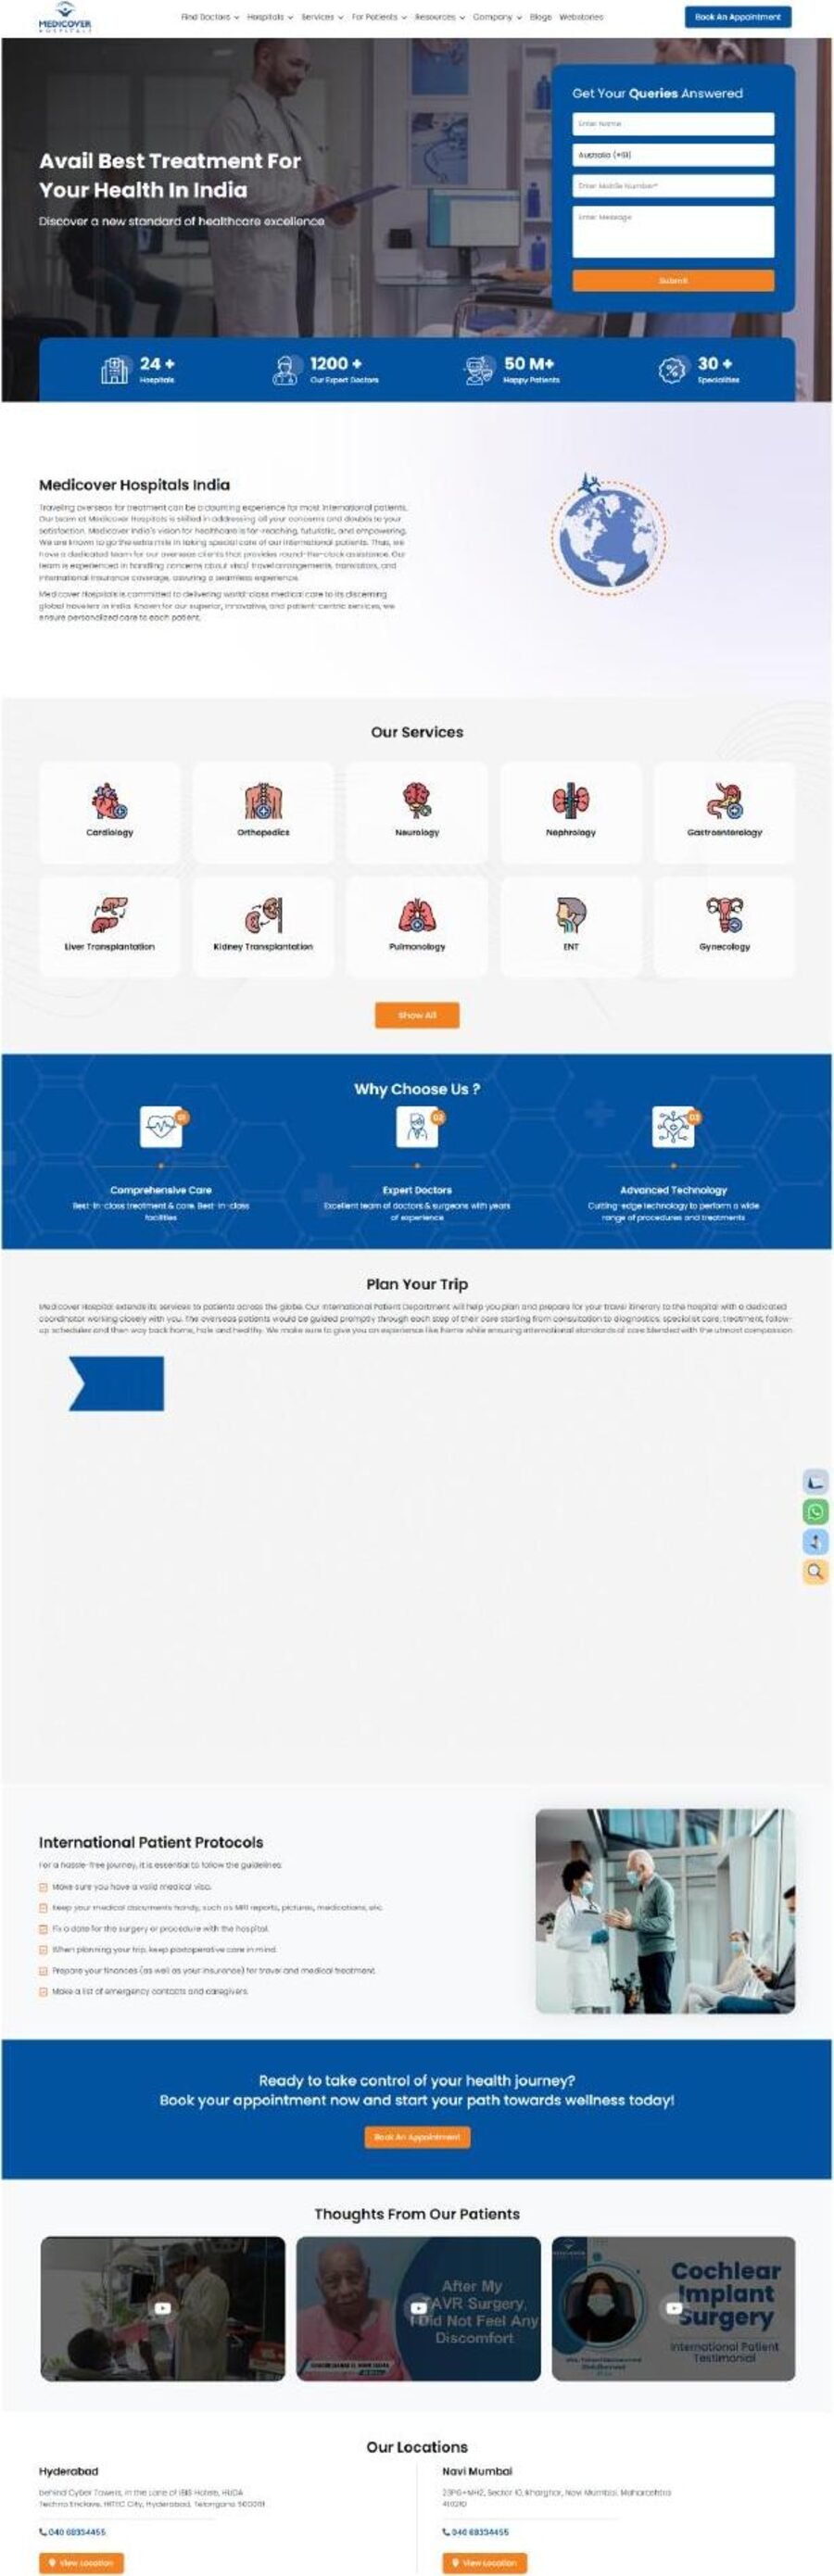
02

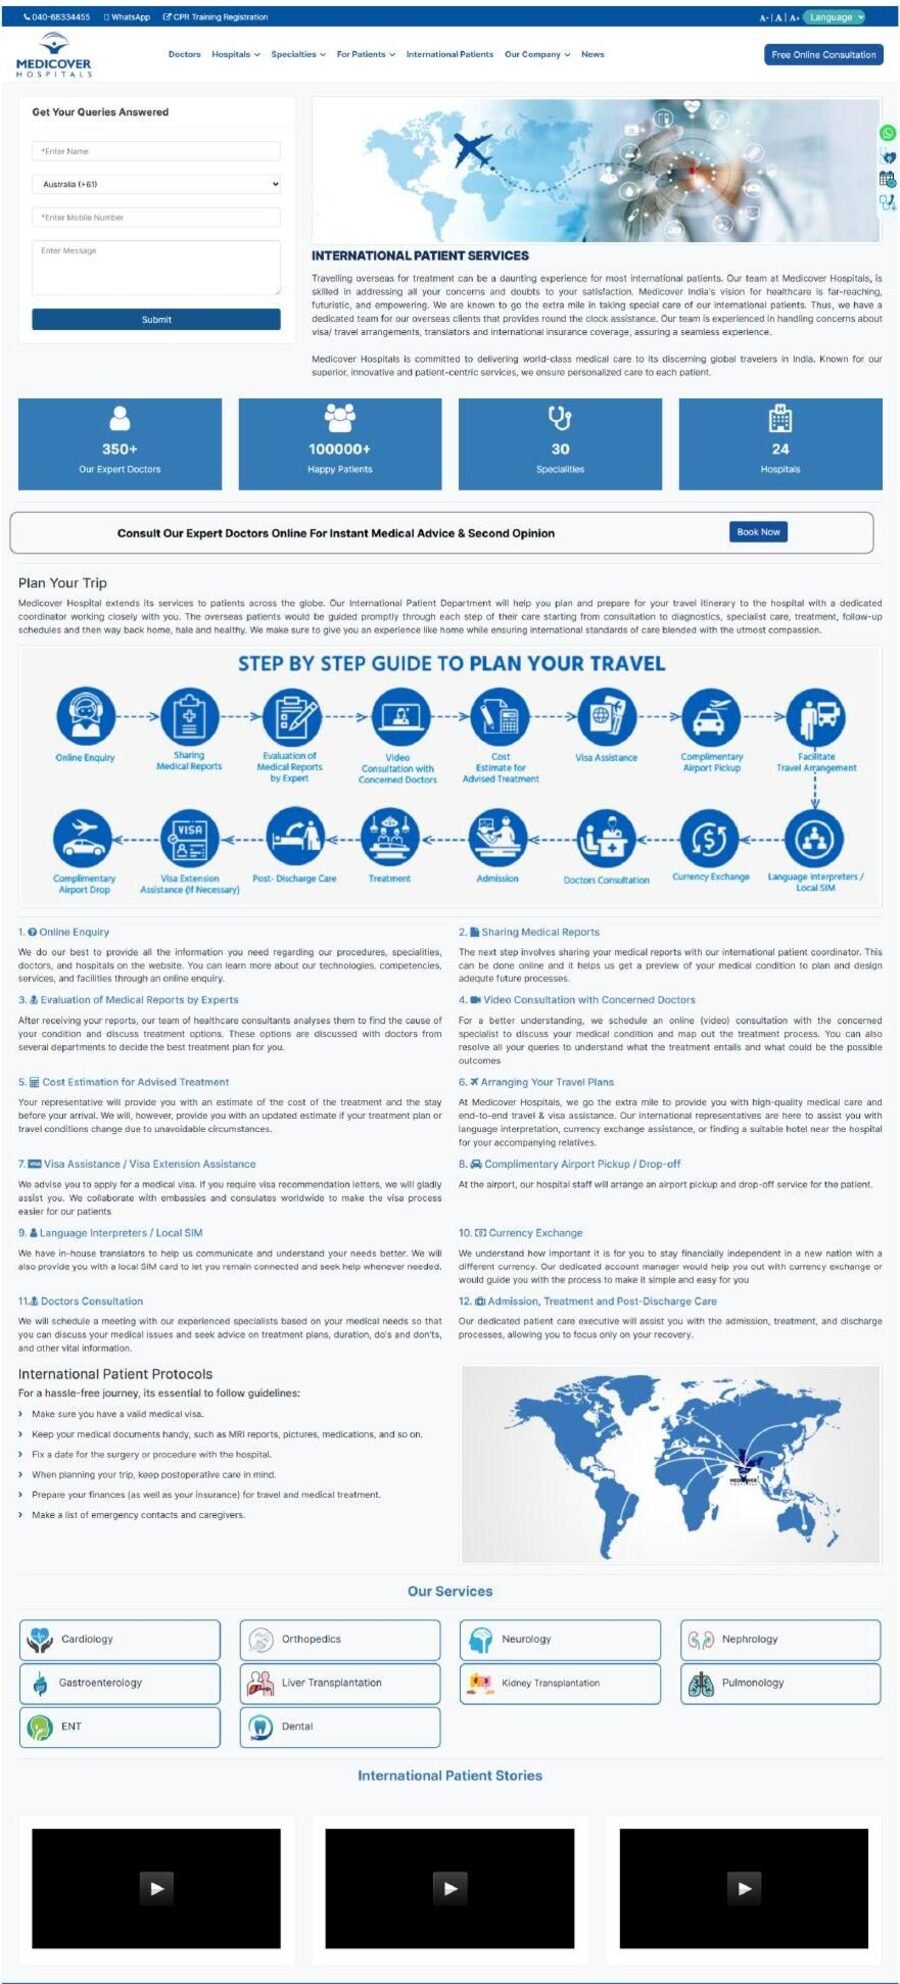
International Patients

A globally-searched service buried in dense copy.

Before
  • Long paragraphs carrying the whole journey
  • Key travel steps locked inside a flat image
  • Credibility numbers hard to find
  • Services listed as plain text rows
After
  • Hero with an enquiry form above the fold
  • Credibility bar: hospitals, doctors, patients, specialties
  • Services as a scannable icon grid
  • Plan-your-trip, protocols, patient stories and locations
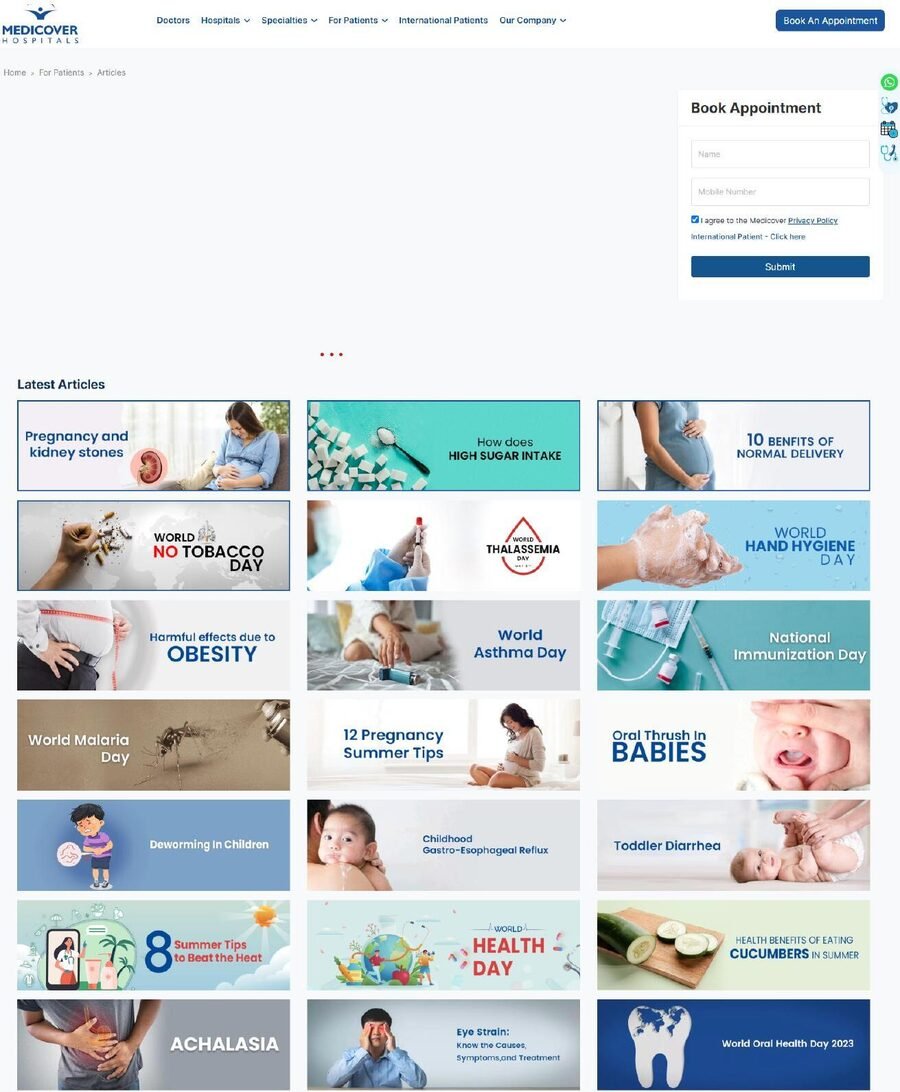
03

Articles & Blog

Content existed, but nothing made it discoverable.

Before
  • Flat grid of image tiles, no structure
  • No categories, tags or filtering
  • Appointment form competing with the content
  • No sense of what’s current or popular
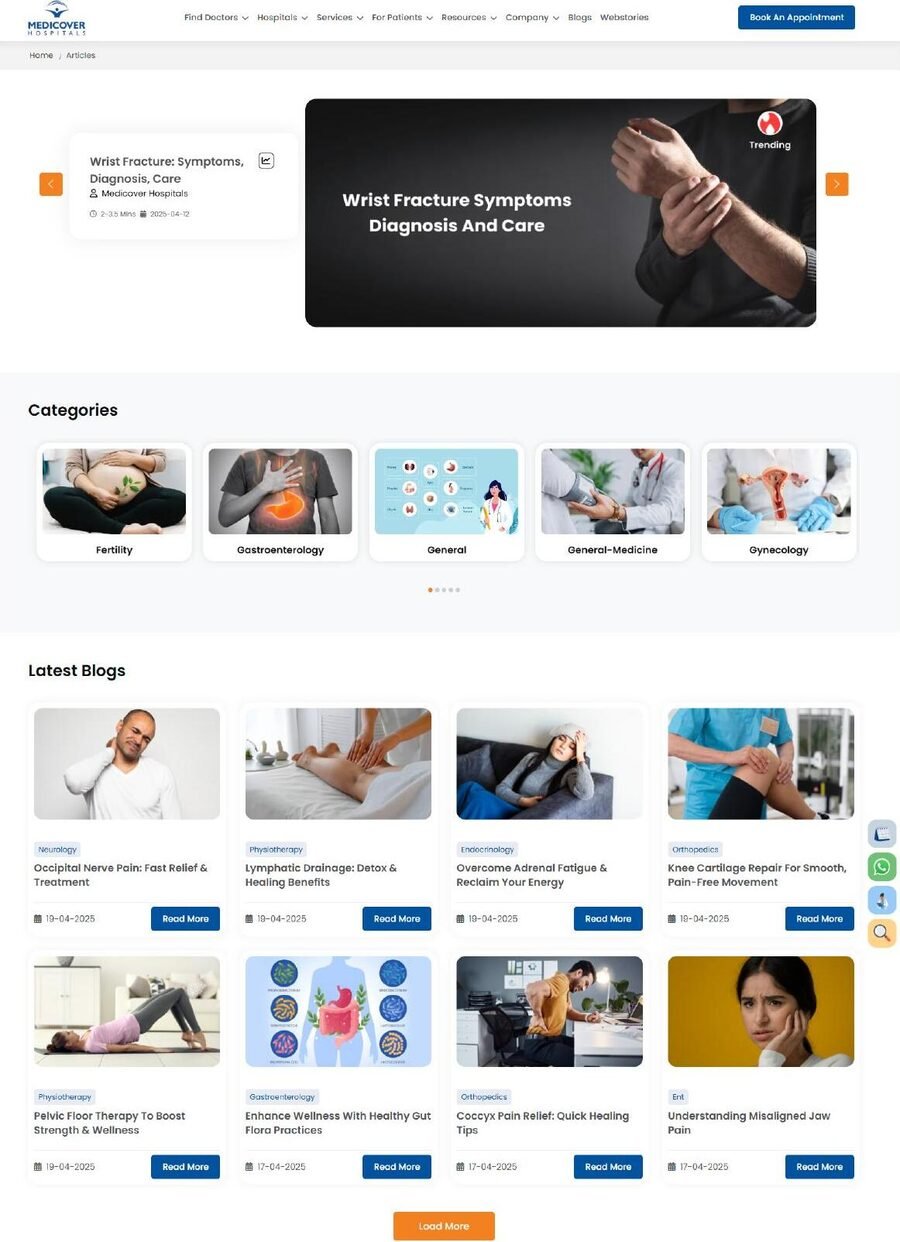
After
  • Trending hero surfacing the lead article
  • Category navigation across specialties
  • Cards carrying specialty, date and read time
  • Clear read-more paths and pagination

Screenshots: Medicover growth & performance report.

New capability · built from zero

Web Stories & health calculators

Not a redesign - formats that didn’t exist on the site before.

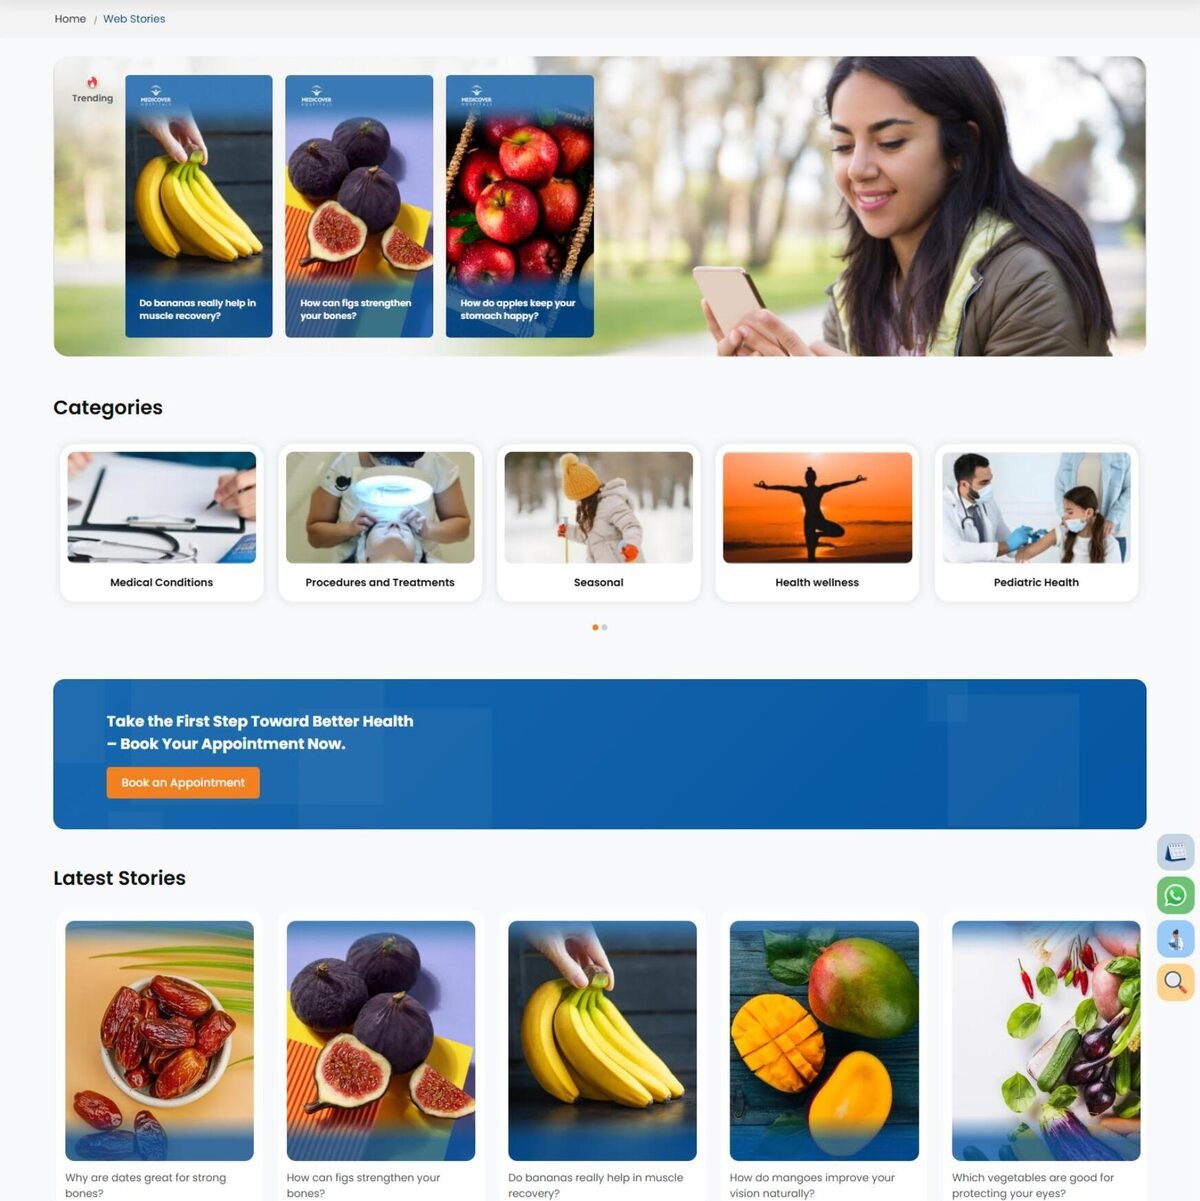
Medicover Web Stories hub with trending stories, categories and latest stories

Why it matters

  • Web Stories reach Google’s visual, mobile-first surfaces that ordinary pages can’t
  • Snackable health content pulls patients in earlier - before they’re searching for a hospital
  • Categories span medical conditions, procedures, seasonal and paediatric health
  • Health calculators give patients a reason to interact, not just read
  • Both feed the same funnel: a booking CTA sits inside the experience

Core Web Vitals

The vitals, before and now

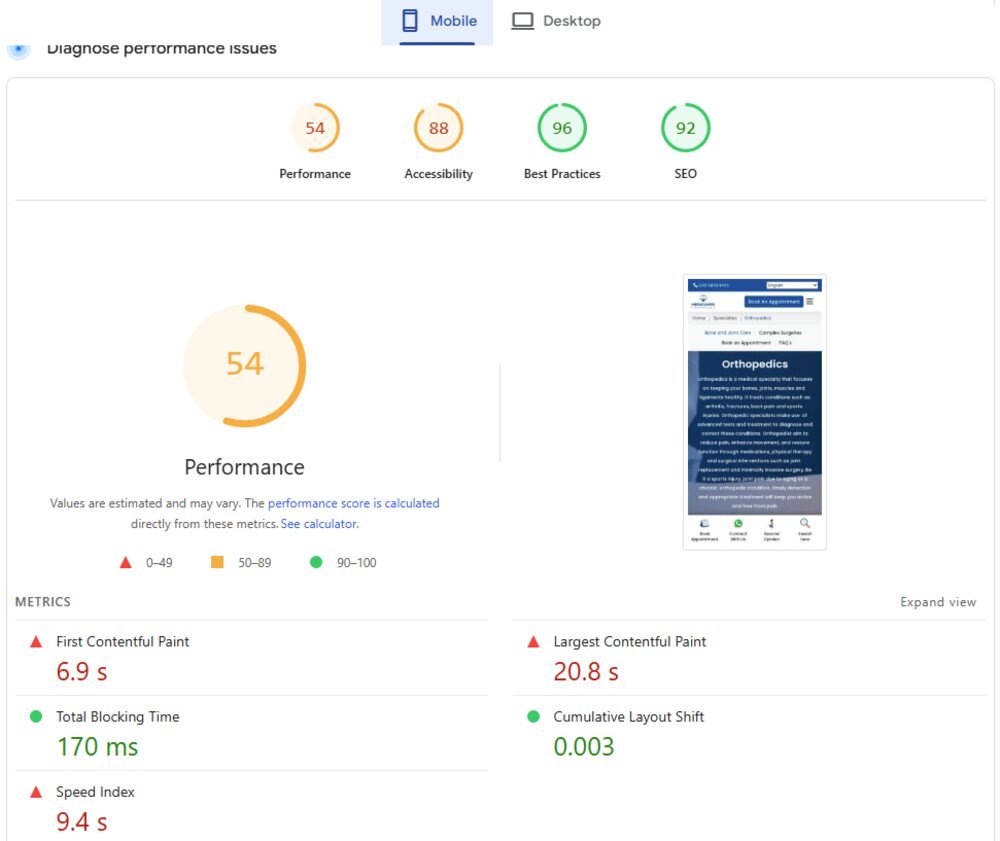
Google’s threshold for a good LCP is 2.5 seconds. The orthopedics specialty page was eight times over it.

Baseline
20.8sLCP
6.9sFCP
9.4sSpeed Index
Lighthouse mobile report for the orthopedics page showing a performance score of 54, LCP 20.8 seconds and FCP 6.9 seconds

Where those 20.8 seconds went

TTFB4%740ms
Load delay61%12,690ms
Load time34%7,040ms
Render delay1%300ms

Source: Core Web Vitals SOP for Specialities.

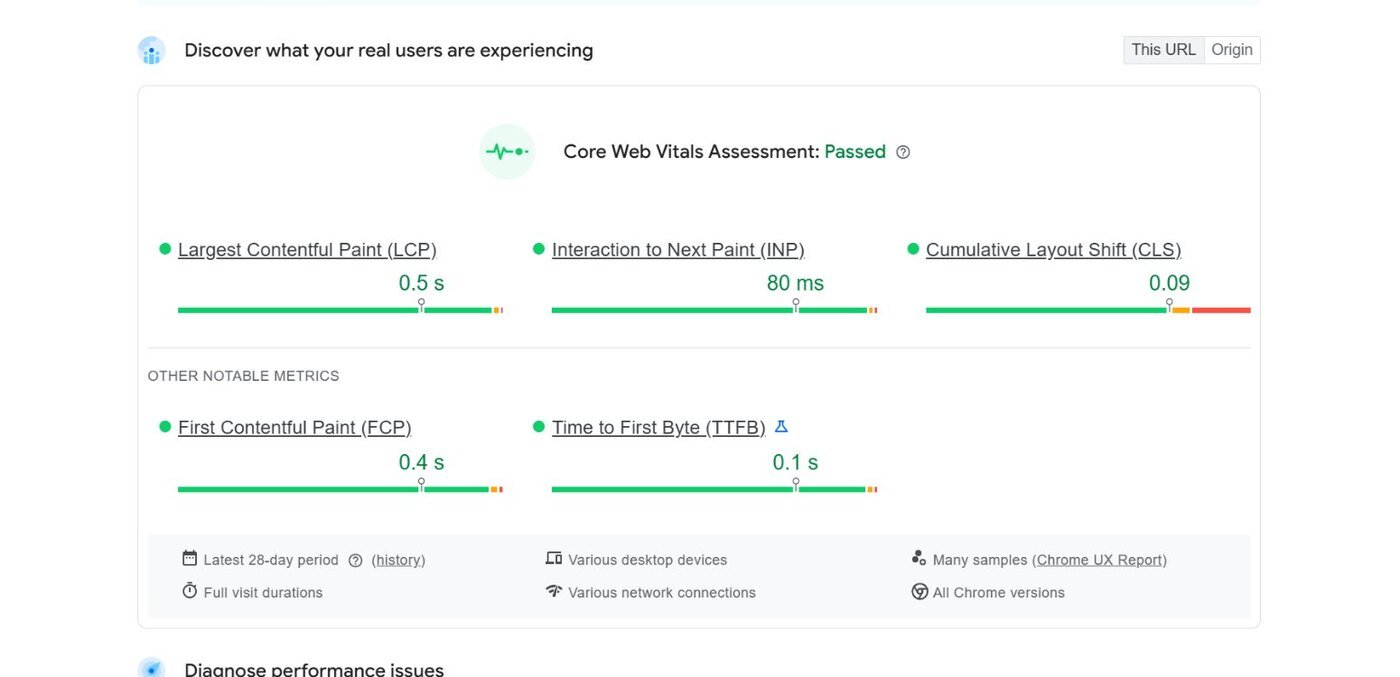
Today · assessment passed
0.5sLCP
80msINP
0.09CLS
PageSpeed Insights showing Core Web Vitals Assessment passed for medicoverhospitals.in with LCP 0.5s, INP 80ms and CLS 0.09

Other notable metrics

First Contentful PaintGood0.4s
Time to First ByteGood0.1s

Source: PageSpeed Insights, 15 Jul 2026 - real-user field data.

Read this carefully

The 20.8s baseline is a Lighthouse lab test of one specialty page. The 0.5s is field data for the homepage. Different page, different measurement - a like-for-like re-run of /specialties/orthopedics would close the loop.

Still on the list

Lab performance sits at 65: render-blocking requests (~380ms), 272KiB unused JavaScript, 18KiB unused CSS, 7 long main-thread tasks and a lab CLS of 1.661 all remain open.

The fix list

Ten issues, each with a documented fix

Not recommendations - the actual changes specified, page by page, in the SOP, with the sample page as the reference implementation.

Issue foundWhat we changed
LCP at 20.8sPreload the banner image · move the CSS background to a real <img> · inline critical CSS
Render-blocking resourcesDefer non-critical scripts · preload key stylesheets
Text compression failingBrotli enabled at the CDN (Cloudflare → Speed → Optimization)
Heavy main-thread workMove or defer scripts not needed for first render
Unused CSSExtract critical CSS with Critical / Penthouse
Unused JavaScriptStrip and defer unused bundles
Images with no width/heightExplicit width & height, plus CSS aspect-ratio
Weak cache policyCache-Control: public, max-age=31536000, immutable
Oversized imagesServe correctly sized images per breakpoint
Offscreen imagesLazy-load anything below the fold

The unglamorous part

The problems that don’t fit in a pitch deck

Most of this engagement was infrastructure nobody sees. It’s also the reason the rest worked.

Server kept going down

Repeated outages broke crawling and indexing. Rankings can’t hold on a site Google can’t reach.

Translated URLs broke canonicals

G-Translator rewrote URL structure into local languages, creating canonical and index conflicts.

Pages vanished from the server

Missing pages were recovered from Wayback Machine backups and re-uploaded.

Bulk restoration at scale

Rebuilt via database and PHP file upload rather than page-by-page.

Toxic backlinks

Spam links identified and disavowed to protect domain authority.

Quarterly regressions

Session drops, click decay and low-quality content tracked and fixed on a rolling basis.

Results

What 16 months delivered

Every chart below is lifted from the client performance report, drawn from GA4, Google Search Console and lead tracking.

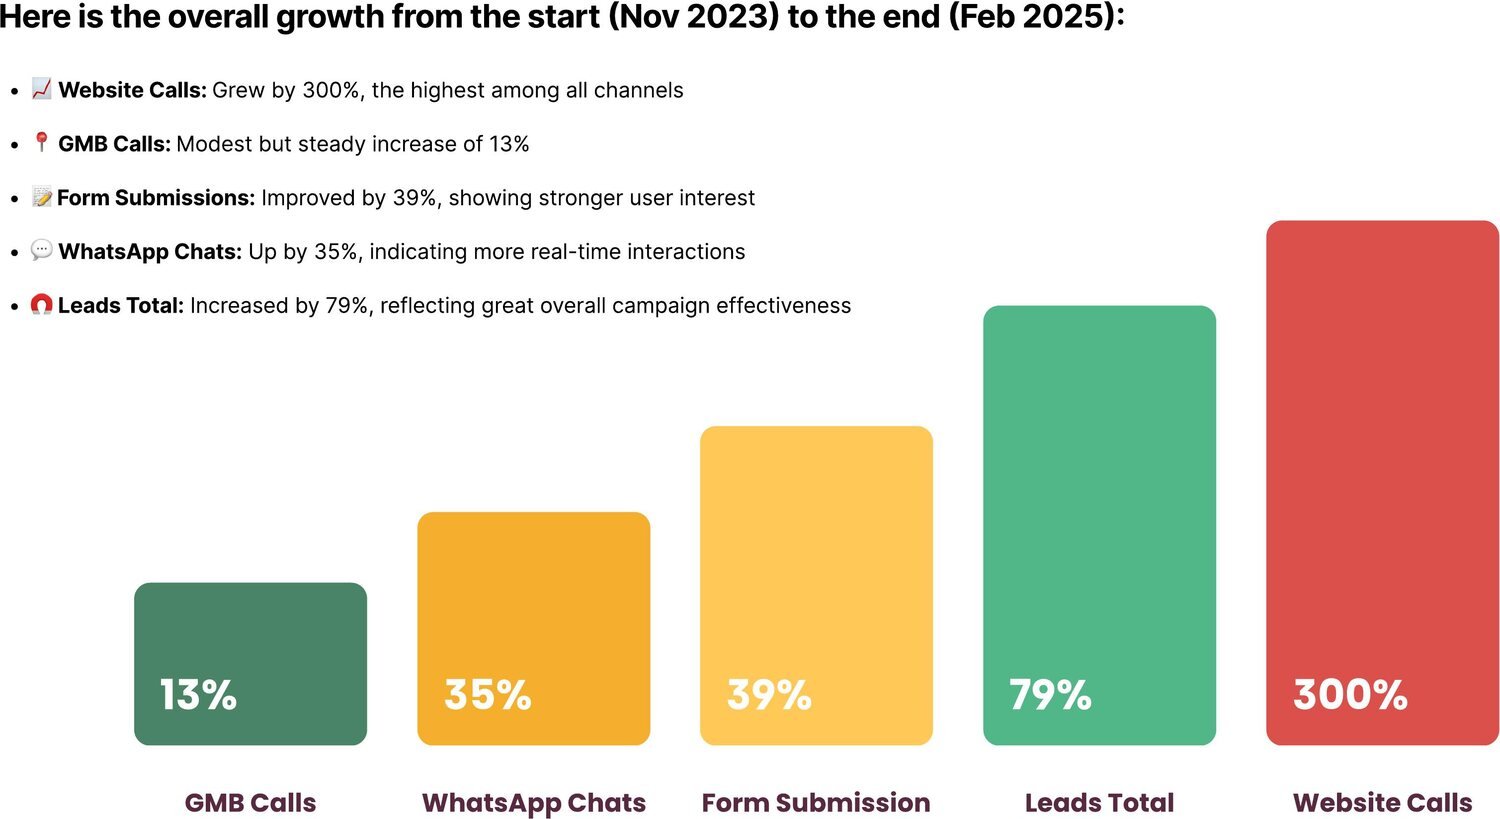
Overall growth by channel

Nov 2023 → Feb 2025

Overall growth: GMB calls 13%, WhatsApp chats 35%, form submissions 39%, total leads 79%, website calls 300%

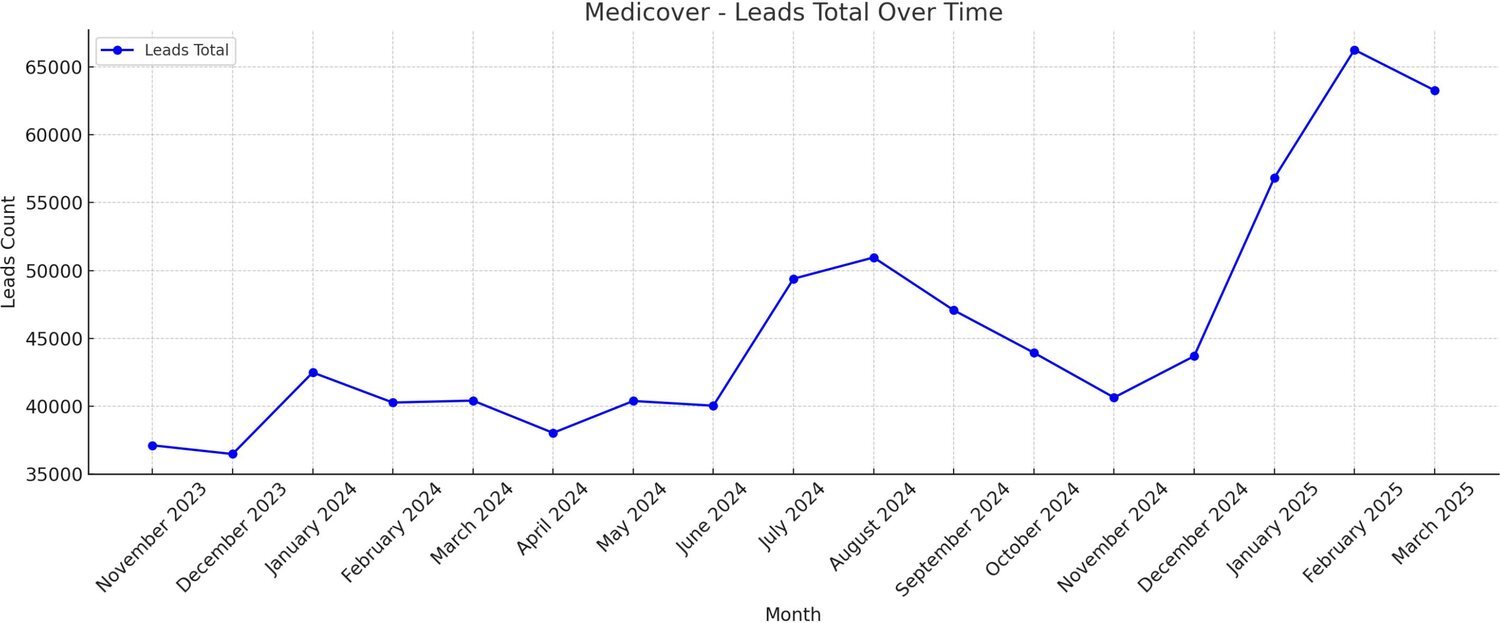
Total leads over time

Monthly, Nov 2023 → Mar 2025

Line chart of Medicover total leads per month, rising from about 37,000 to a peak above 66,000

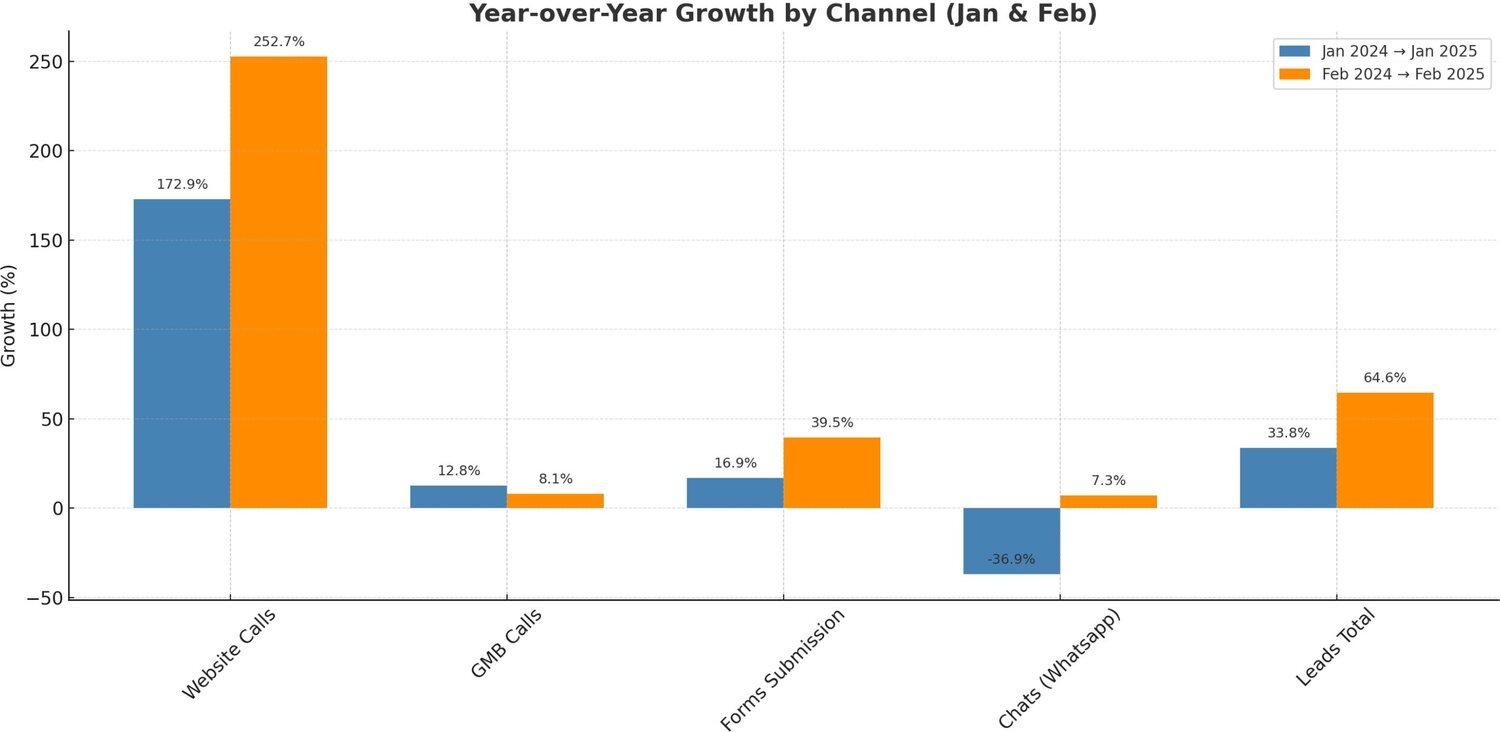
Year-over-year growth by channel

Jan & Feb, 2024 vs 2025

Year-over-year growth by channel for January and February, website calls up 252.7 percent in February

Evidence

The traffic engine behind the leads

Search visibility and audience growth, straight from the consoles.

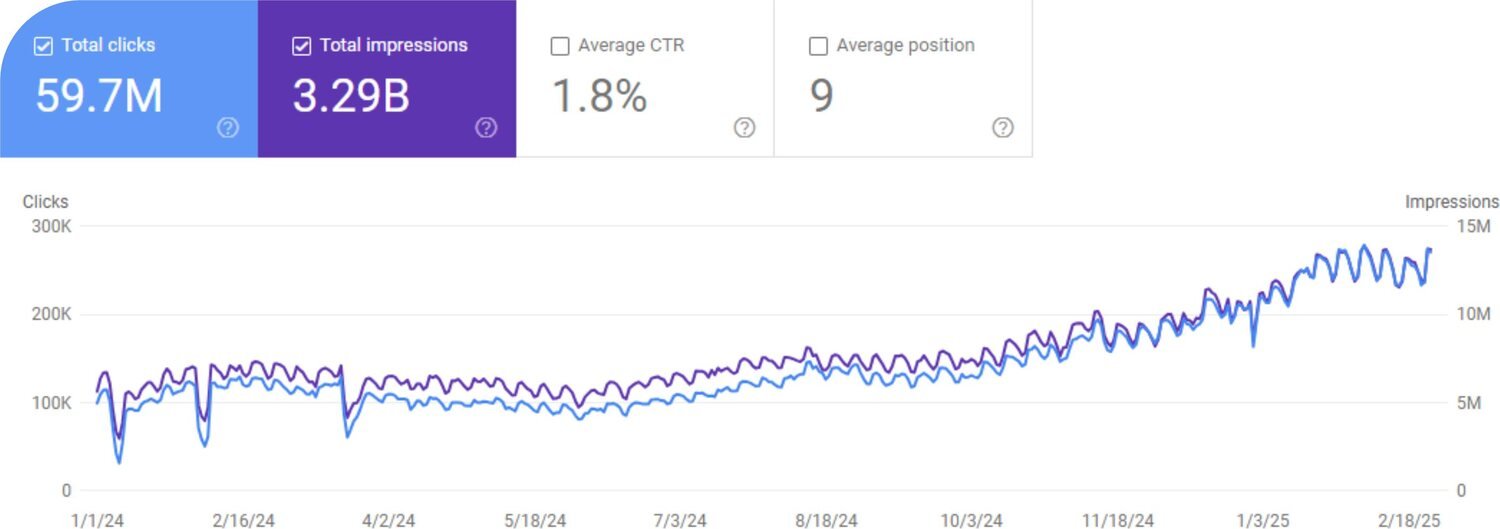
Google Search Console - clicks & impressions

59.7M clicks · 3.29B impressions · 1.8% average CTR · average position 9

Google Search Console chart showing 59.7 million clicks and 3.29 billion impressions trending upward through Feb 2025

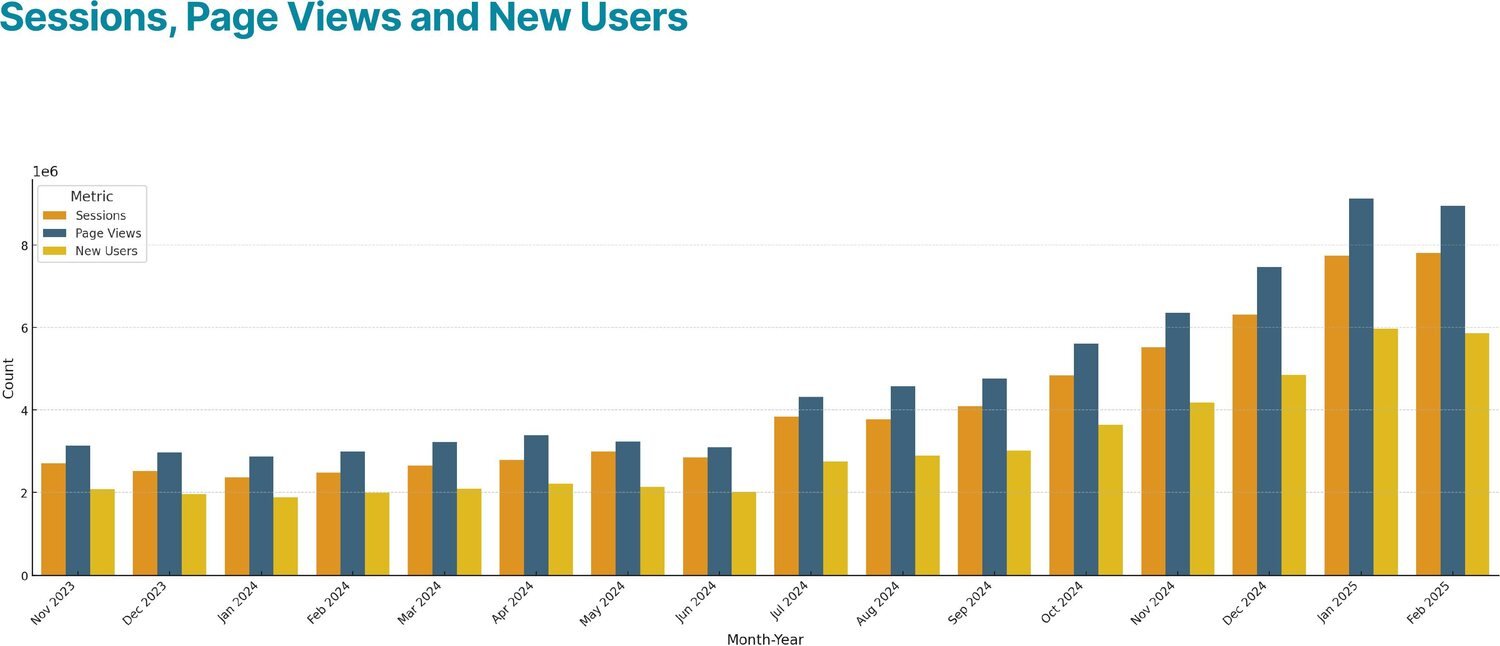
Sessions, page views & new users

Google Analytics · monthly

Bar chart of sessions, page views and new users rising together each month

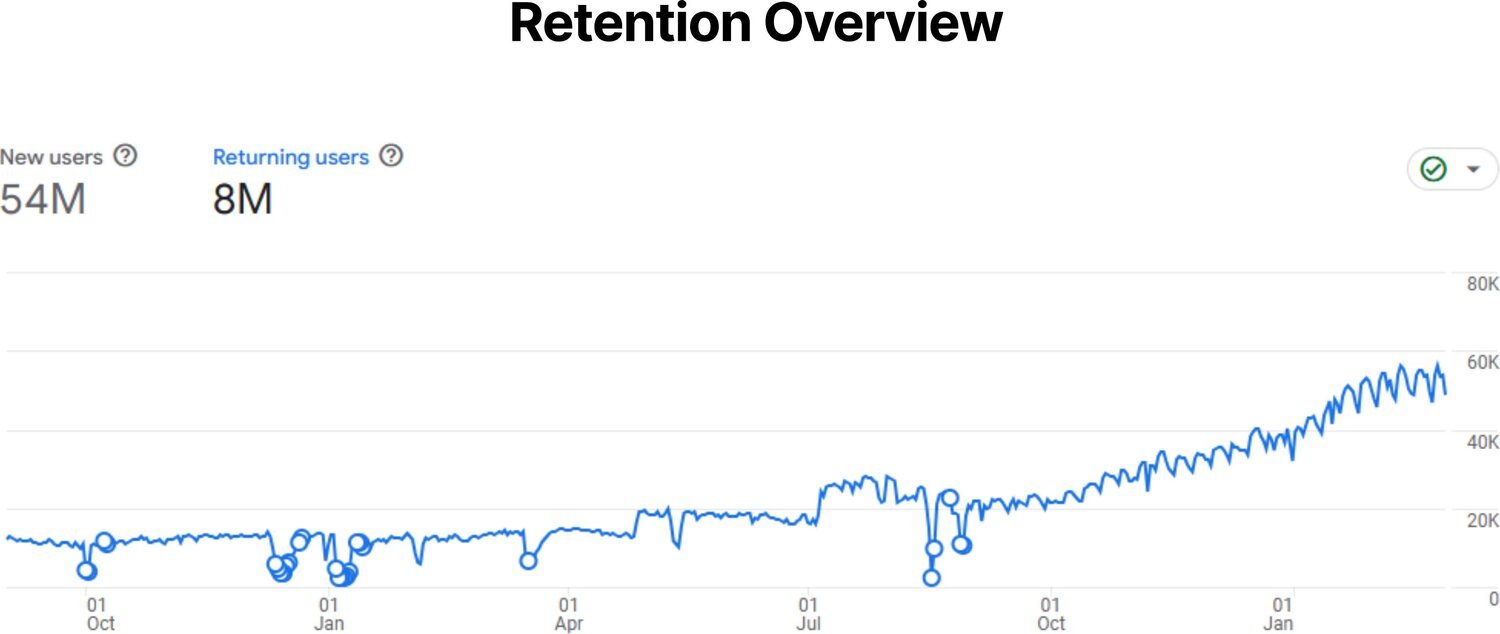
Retention

54M new users · 8M returning

Retention overview showing 54 million new users and 8 million returning users

Ooi Solutions

We do this for healthcare at scale.

16 months, 23 interventions, +79% leads - and every number on this page can be checked in GA4, Search Console or PageSpeed Insights. That’s the point.

ooisolutions.in  ·  hello@ooisolutions.in