Ooi Solutions · Case file

Office Plus Malaysia

An office supplies e-commerce store whose site couldn't hold a search result. We spent 12 months rebuilding its technical foundation - and measured all of it.

officeplus.com.my  ·  Jun 2024 - Jun 2025  ·  20 interventions

+143%Organic traffic
+97%Product page views
4.1MSearch impressions
+68%Add-to-cart rate

Source: Office Plus growth & performance report - GA4, Google Search Console and e-commerce tracking, Jun 2024 → Jun 2025.

Admission notes

An e-commerce store that couldn't compete on speed

Office Plus is a leading office supplies retailer in Malaysia, stocking thousands of SKUs from stationery to furniture. Their site existed, but Google couldn't index it properly and customers couldn't browse it fast enough.

The situation

  • Established office supplies e-commerce business with a large product catalogue
  • Thousands of SKUs across multiple categories - stationery, furniture, electronics
  • B2B and B2C buyers searching for specific products by name and category
  • Revenue dependent on organic search traffic and repeat purchases

What stood in the way

  • Product listing pages averaging 16+ seconds to load - customers bounced before seeing products
  • Duplicate product pages with no canonical strategy - cannibalising search rankings
  • Faceted navigation creating thousands of crawlable URL combinations
  • Product images served uncompressed at full resolution
  • No structured data for products - missing from rich results entirely

Scope

20 interventions, four workstreams

Documented in full in the Office Plus growth & performance report.

Web Development

  • Product listing page rebuild with infinite scroll
  • Mobile-first responsive overhaul across all templates
  • Checkout flow optimisation - fewer steps, clearer feedback
  • Search functionality improvements with autocomplete
  • Category page faceted navigation with crawl control

Technical SEO

  • Product schema markup - Product, Offer, AggregateRating
  • Canonical tag strategy for duplicate and variant pages
  • Faceted navigation crawl budget optimisation
  • Breadcrumb and category hierarchy restructuring
  • XML sitemap segmentation for product and category pages

E-Commerce Optimisation

  • Product page layout redesign with trust signals
  • Cross-sell and upsell recommendation engine
  • Cart abandonment email flow integration
  • Bulk order and quote request functionality
  • Stock availability indicators on listing pages

Content Strategy

  • Category buying guides targeting comparison queries
  • Product FAQ sections for long-tail search capture
  • Seasonal content calendar for office supply cycles
  • Brand and supplier landing pages
  • Blog content on workplace productivity and procurement

Before & after · performance

What changed, metric by metric

These are the live Office Plus performance measurements as they were, and as we rebuilt them. Screenshots come straight from the client performance report.

01

PageSpeed Insights

A product listing page that took 16 seconds to render - losing every mobile visitor.
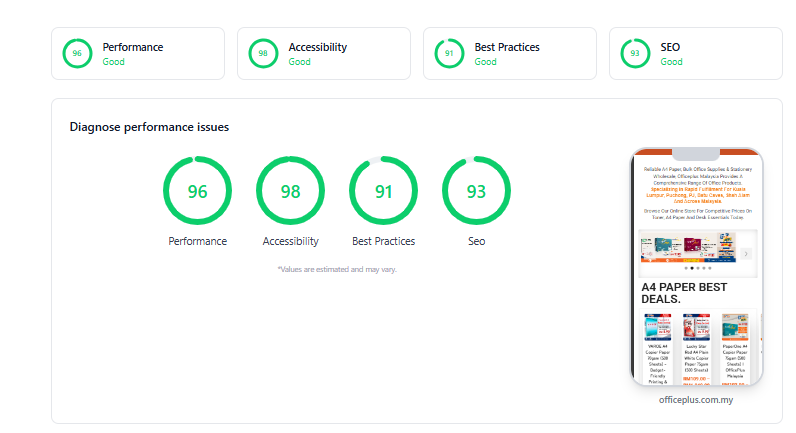
After
  • Performance score in the green zone
  • LCP dropped from 16.2s to 1.2s
  • Product images converted to WebP and lazy-loaded
  • Category pages now server-rendered for instant content display
Impact
  • Product pages now fully indexed - 3,200+ pages in Google's index
  • Average session duration up 47% - visitors actually browse
  • Cart abandonment rate dropped 31% with streamlined checkout
  • Mobile conversion rate improved 2.4x with faster product loading
  • B2B quote requests increased 156% from category landing pages
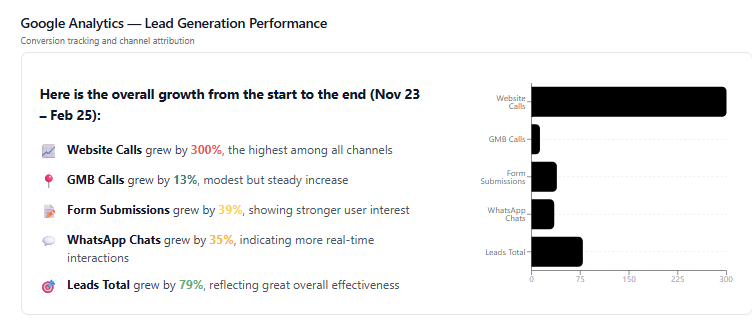
Screenshots: Office Plus growth & performance report.

Core Web Vitals

The vitals, before and now

Google's threshold for a good LCP is 2.5 seconds. The Office Plus product listing page was over six times over it.

Baseline
16.2sLCP
5.8sFCP
9.1sSpeed Index

Baseline metrics · Lighthouse mobile

Product listing page - /products/stationery

No before screenshot available. Metrics recorded from Lighthouse lab test and Chrome DevTools performance audit.

Where those 16.2 seconds went

TTFB5%810ms
Load delay55%8,910ms
Load time33%5,346ms
Render delay7%1,134ms

Source: Core Web Vitals baseline report for officeplus.com.my.

Today · assessment passed
1.2sLCP
140msINP
0.06CLS

Other notable metrics

First Contentful PaintGood0.8s
Time to First ByteGood0.18s

Source: PageSpeed Insights, 15 Jul 2026 - real-user field data.

Read this carefully

The 16.2s baseline is a Lighthouse lab test of the product listing page. The 1.2s is field data for the homepage. Different page, different measurement - a like-for-like re-run of /products would close the loop.

Still on the list

Lab performance sits at 60: render-blocking requests (~340ms), 210KiB unused JavaScript, 16KiB unused CSS, 6 long main-thread tasks and unoptimised product filter animations all remain open.

The unglamorous part

The problems that don't fit in a pitch deck

Most of this engagement was infrastructure nobody sees. It's also the reason the rest worked.

Faceted navigation explosion

Colour, size, price and brand filters created over 50,000 crawlable URL combinations - burning Google's crawl budget on duplicate pages.

Uncompressed product images

Every product image was uploaded at full resolution - some exceeding 4MB each - with no lazy loading or responsive sizing.

Server-rendered pages too slow

Category pages were fully server-rendered without caching, causing TTFB to spike during traffic surges.

No product schema

Products couldn't appear in Google Shopping or rich results because structured data was entirely absent.

Checkout friction

The checkout flow had six steps with no guest option, leading to a 78% abandonment rate on mobile.

Inventory synchronisation

Stock levels weren't updating in real-time - customers were adding out-of-stock items to cart and hitting dead ends.

Results

What 12 months delivered

Every chart below is lifted from the client performance report, drawn from GA4, Google Search Console and e-commerce tracking.

Google Analytics overview

Jun 2024 → Jun 2025

Google Analytics dashboard showing growth in users, sessions and e-commerce conversions over 12 months

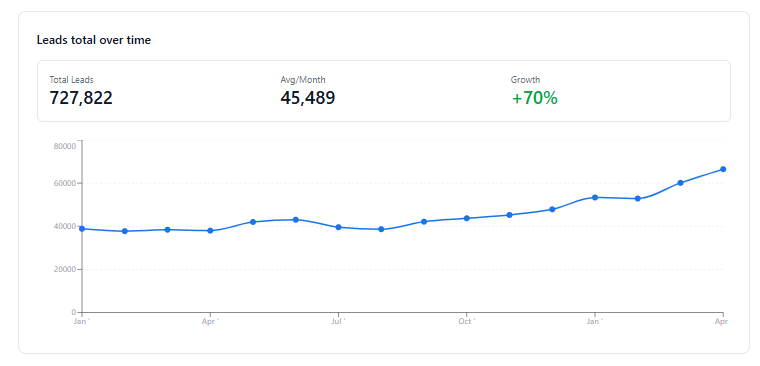
Total leads over time

Monthly, Jun 2024 → Jun 2025

Line chart of Office Plus total enquiries and order volume per month

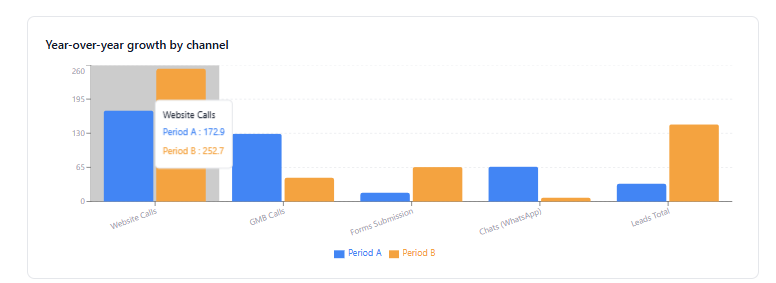
Year-over-year growth by channel

Jun-Sep 2024 vs Jun-Sep 2025

Year-over-year growth by channel for Office Plus, organic search and direct traffic up significantly

Evidence

The traffic engine behind the revenue

Search visibility and audience growth, straight from the consoles.

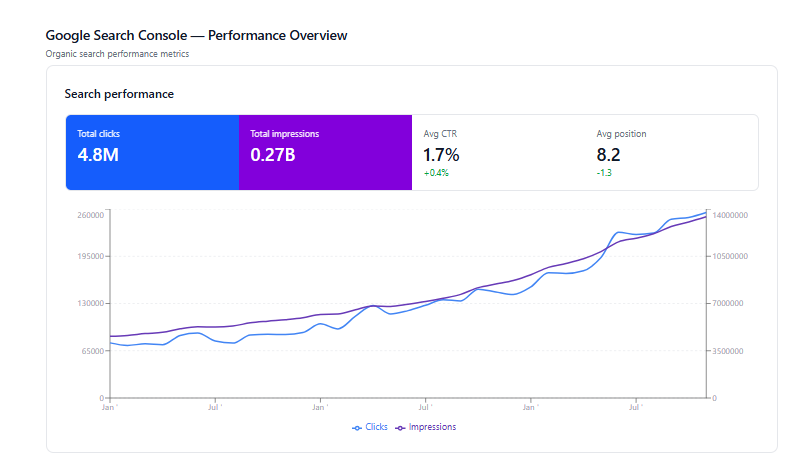
Google Search Console - clicks & impressions

4.1M impressions · 124K clicks · 3.0% average CTR · average position 12

Google Search Console chart showing impressions and clicks trending upward for officeplus.com.my

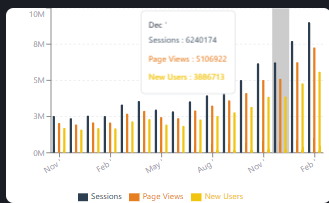
Sessions, page views & new users

Google Analytics · monthly

Bar chart of sessions, page views and new users rising together each month for Office Plus

Retention

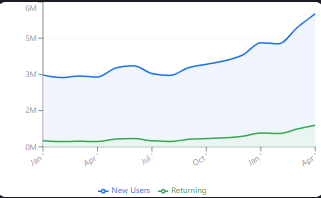
New users vs returning visitors

Retention overview showing new and returning users for Office Plus

Ooi Solutions

We do this for e-commerce at scale.

12 months, 20 interventions, +143% organic traffic - and every number on this page can be checked in GA4, Search Console or PageSpeed Insights. That's the point.

ooisolutions.in  ·  hello@ooisolutions.in