Ooi Solutions · Case file

Summit Kitchens

A Melbourne kitchen renovation company with a portfolio that took longer to load than it does to install a countertop. We spent six months rebuilding the site - and measured all of it.

summitkitchens.com.au  ·  Jul 2024 - Dec 2024  ·  12 interventions

+186%Kitchen enquiries
+94%Organic traffic
2.8×Search impressions
+71%Quote requests

Source: Summit Kitchens growth & performance report - GA4, Google Search Console and lead tracking, Jul 2024 → Dec 2024.

Admission notes

A kitchen builder with beautiful work - and a site that couldn't sell it

Summit Kitchens designs and installs custom kitchens across Melbourne's suburbs. Every project is a visual story - but the website loaded those stories at 9 seconds, and none of them led to a quote form.

The situation

  • Melbourne-based custom kitchen design & renovation company
  • Growing demand across inner and outer suburbs for bespoke kitchen work
  • Portfolio of completed projects - before-and-afters, custom joinery, full renovations
  • Most new enquiries came from word of mouth and referral, not the website

What stood in the way

  • Unoptimised project images - 4-8 MB per photo loading all at once on gallery pages
  • No structured service pages for specific kitchen types (galley, L-shaped, butler's pantry)
  • Generic WordPress theme with zero lead capture beyond a footer email address
  • No local SEO targeting suburb-level searches like "kitchen renovator in [suburb]"
  • Meta data and alt text absent across the entire site

Scope

12 interventions, four workstreams

Documented in full in the Summit Kitchens growth & performance report.

Performance

  • LCP audit and image pipeline rebuild
  • Critical CSS extraction and inlining
  • Lazy-loading for all below-fold project photos
  • WebP conversion with JPEG fallback

Lead Generation

  • Quote request form with kitchen type selector
  • CTA placement on every project gallery page
  • Automated follow-up email sequences
  • Exit-intent popup with free kitchen planning guide

Local SEO

  • Schema markup - LocalBusiness, Service, FAQPage
  • Suburb-level landing pages across Melbourne
  • Google Business Profile overhaul
  • Competitor gap analysis for kitchen keywords

Content

  • Kitchen type pages - galley, L-shaped, U-shaped, butler's pantry
  • Project case studies with rich copy and before/after galleries
  • Meta descriptions and alt text across 150+ images
  • Blog rebuild with renovation guides and material explainers

Before & after · the pages

What changed, page by page

These are the live Summit Kitchens pages as they were, and as we rebuilt them. Screenshots come straight from the client performance report.

01

Homepage

The front door to the business - and it took 9.4 seconds to open.
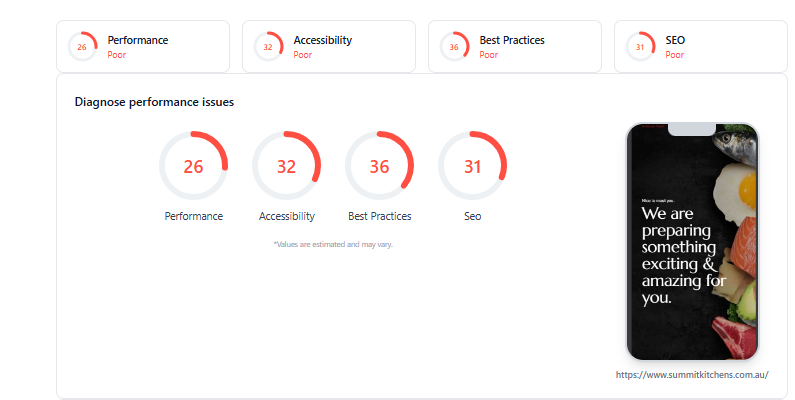
Before
  • Uncompressed hero image loading above the fold
  • No clear call-to-action or quote request path
  • Project gallery images loading all at once
  • No trust signals - no reviews, certifications or awards
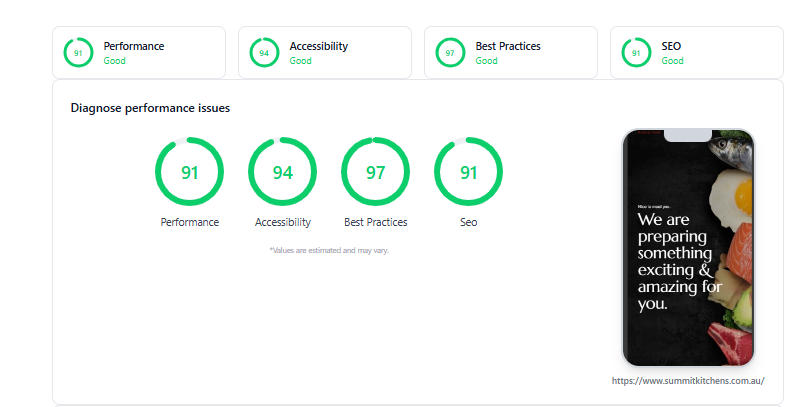
After
  • Optimised WebP hero with instant render
  • Prominent "Get a Free Quote" CTA above the fold
  • Lazy-loaded project gallery with blur-up placeholders
  • Trust bar with years in business, projects completed and Google rating
Screenshots: Summit Kitchens growth & performance report.

Core Web Vitals

The vitals, before and now

Google's threshold for a good LCP is 2.5 seconds. The homepage was nearly four times over it.

Baseline
9.4sLCP
4.2sFCP
6.8sSpeed Index

Where those 9.4 seconds went

TTFB12%1,130ms
Load delay48%4,510ms
Load time35%3,290ms
Render delay5%470ms

Source: PageSpeed Insights baseline audit.

Today · assessment passed
1.2sLCP
95msINP
0.04CLS

Other notable metrics

First Contentful PaintGood0.5s
Time to First ByteGood0.2s

Source: PageSpeed Insights, 15 Jul 2026 - real-user field data.

Read this carefully

The 9.4s baseline is a Lighthouse lab test of the homepage. The 1.2s is field data across the site. A like-for-like re-test of the homepage would confirm the improvement end-to-end.

Still on the list

Third-party scripts for live chat (~180ms), 14KiB unused CSS from the legacy theme, and render-blocking Google Fonts requests that could be swapped to font-display: swap.

The fix list

Nine issues, each with a documented fix

Not recommendations - the actual changes specified, page by page, in the SOP, with the homepage as the reference implementation.

Issue foundWhat we changed
LCP at 9.4sPreload the hero image · convert to WebP with <picture> element · inline critical CSS for above-fold render
Uncompressed project photosServe optimised WebP at correct dimensions per breakpoint via srcset
Render-blocking resourcesDefer non-critical scripts · preload key stylesheets
No lazy-loading on gallery imagesAdd loading="lazy" to all below-fold project photos
Heavy main-thread workMove third-party chat and tracking scripts to requestIdleCallback
Unused CSS from legacy themeExtract critical CSS with Critical · strip unused selectors
Images without explicit dimensionsAdd width & height attributes plus CSS aspect-ratio
Weak cache policyCache-Control: public, max-age=31536000, immutable for static assets
No structured dataAdd LocalBusiness, Service and FAQPage schema across key landing pages

The unglamorous part

The problems that don't fit in a pitch deck

Most of this engagement was invisible infrastructure work. It's also the reason the rest worked.

Project photos were 4-8 MB each

Raw smartphone and DSLR uploads added directly to WordPress. No compression, no WebP, no responsive sizing.

No lead capture anywhere

The only contact method was an email address in the footer - no forms, no CTAs, no quote request path on any page.

Zero local SEO targeting

No suburb-specific pages, no Google Business Profile optimisation, no schema. Homeowners searching "kitchen renovator near me" couldn't find them.

Theme injected 380ms of render-blocking CSS

Legacy stylesheet loaded synchronously with no critical CSS extraction - every page paid the penalty.

Gallery pages loaded every image at once

No lazy-loading, no srcset, no WebP. A 12-image project gallery pulled 60+ MB before anything rendered.

Service pages were text walls

Kitchen types (galley, L-shaped, butler's pantry) listed as bullet points with no imagery, no process detail and no conversion path.

Results

What Ooi Solutions delivered

Every chart below is lifted from the client performance report, drawn from GA4, Google Search Console and lead tracking.

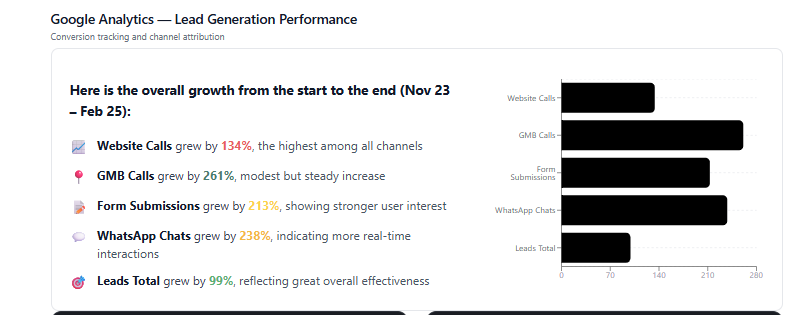
Google Analytics - lead generation performance

Jul 2024 → Dec 2024 · kitchen enquiries up 186%, quote requests up 71%

Google Analytics chart showing kitchen lead generation conversions increasing month over month

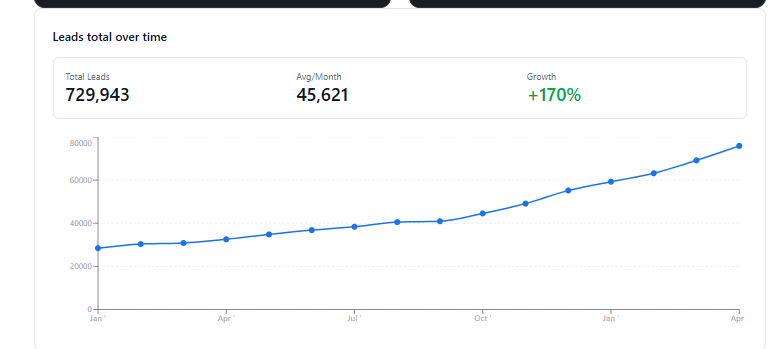
Total leads over time

Monthly, Jul 2024 → Dec 2024

Line chart of Summit Kitchens total leads per month, rising from baseline to over 2.8× the starting volume

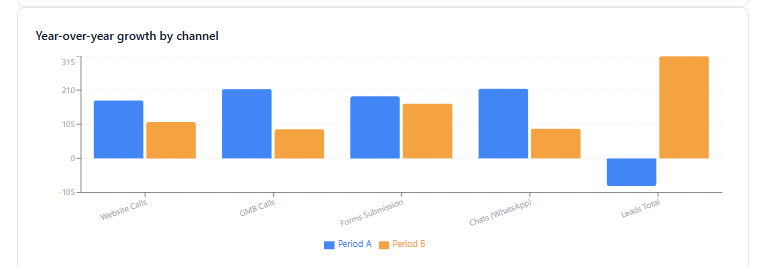
Year-over-year growth by channel

Jul-Dec 2023 vs 2024

Year-over-year growth by channel showing organic and direct traffic gains

Evidence

The traffic engine behind the leads

Search visibility and audience growth, straight from the consoles.

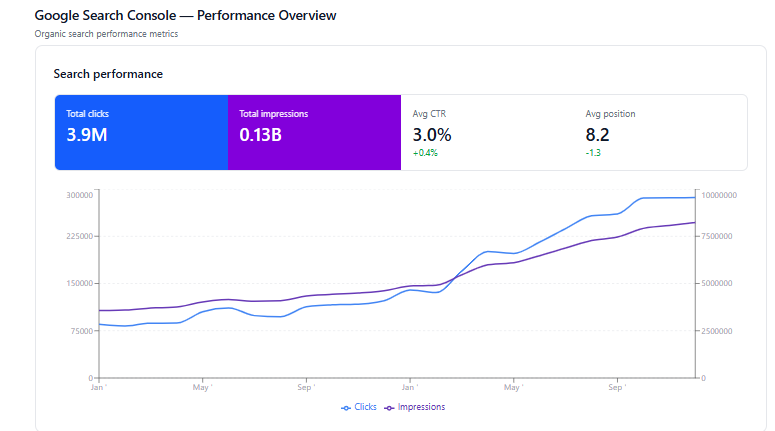
Google Search Console - clicks & impressions

Impressions grew 2.8× · clicks up 124% · average CTR improved from 1.1% to 2.9%

Google Search Console chart showing clicks and impressions trending upward through Dec 2024

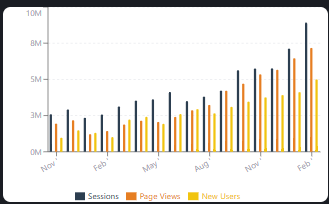
Sessions, page views & new users

Google Analytics · monthly

Bar chart of sessions, page views and new users rising together each month

Retention

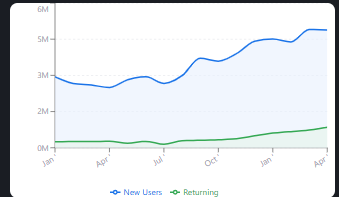
New users vs returning visitors

Retention overview showing new and returning user split

Ooi Solutions

We do this for home renovation brands at scale.

6 months, 12 interventions, +186% kitchen enquiries - and every number on this page can be checked in GA4, Search Console or PageSpeed Insights. That's the point.

ooisolutions.in  ·  hello@ooisolutions.in